 Performance Overview FY2010 - Bluescope Steel Business Segments
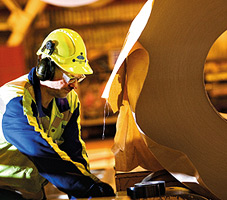
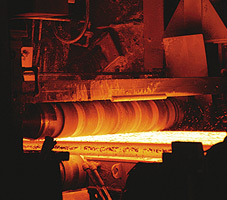
Coated and Industrial Products Australia
Lower result from reduced spread and strong Australian dollar
- Impacted by lower margins, but still delivered an underlying EBIT of $108 million with a 22% increase in domestic sales volume and the benefit of significant cost improvement initiatives
- External export sales volume improved 46% over FY2009 on improved customer demand, and supported by resumed production from No 5 Blast Furnace from August 2009, following its successful reline
- Pricing of COLORBOND® steel remained stable; metal coated products pricing declined compared to FY2009 largely due to the strong Australian dollar
- Western Port and Springhill production volumes increased across all lines as customer demand improved
- Second half result improved over first half particularly due to stronger international steel prices
| FY 2010 | FY 2009 | |
|---|---|---|
| External Despatches ('000s of tonnes) |
||
| Domestic | 1,870 | 1,535 |
| Export | 1,576 | 1,082 |
| Revenue ($M) | 4,745 | 5,291 |
| EBIT ($M) | 84 | 206 |
| Underlying EBIT ($M) | 108 | 141 |
| Net Operating Assets (pre-tax) ($M) | 3,464 | 3,322 |
| Return on Net Assets (pre-tax) | 2% | 6% |
Australia Distribution
and Solutions
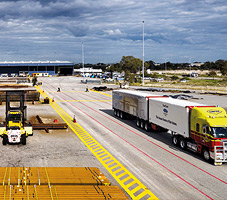
Lower margins reduce earnings
- Strong Australian dollar results in pricing pressure in domestic market, leading to lower margins
- Despatch volumes for BlueScope Lysaght marginally higher
- Soft market conditions continue due to lower consumer demand across most regions of Australia in residential housing sector
- Stronger demand in the building market led to higher production for the Sheet and Coil Processing business
- Pioneer Water has stronger sales activity from seasonal rural spending but building delays in West Australia reduce revenues for Highline
- Interest in BlueScope Buildings range, including pre-engineered steel buildings, remote steel framing supply, and steel building facades, is growing
| FY 2010 | FY 2009 | |
|---|---|---|
| External Despatches ('000s of tonnes) |
||
| Domestic | 754 | 755 |
| Export | 11 | 9 |
| Revenue ($M) | 1,762 | 2,121 |
| EBIT ($M) | 12 | (23) |
| Underlying EBIT ($M) | 2 | 9 |
| Net Operating Assets (pre-tax) ($M) | 881 | 926 |
| Return on Net Assets (pre-tax) | 1% | (2%) |
NEW ZEALAND AND PACIFIC
STEEL PRODUCTS
Year of solid performance
- Domestic despatches 10% higher on improved demand, particularly driven by manufacturing end-use segment
- New steel framing brand, Axxis®, launched with total framing sales up 24%
- Export demand relatively strong
but conditions remain challenging - Markets and project work in Pacific Islands business underpinned strong coated volumes
- Production levels higher across the product range
- Iron sands exports rose by 33%
and vanadium volumes up 4%
| FY 2010 | FY 2009 | |
|---|---|---|
| External Despatches ('000s of tonnes) |
||
| Domestic | 265 | 241 |
| Export | 241 | 273 |
| Revenue ($M) | 618 | 695 |
| EBIT ($M) | 73 | 65 |
| Underlying EBIT ($M) | 73 | 87 |
| Net Operating Assets (pre-tax) ($M) | 398 | 346 |
| Return on Net Assets (pre-tax) | 19% | 20% |
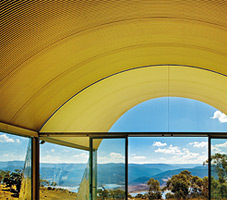
COATED AND BUILDING
PRODUCTS ASIA
Performance turnaround with
record profits
- Asia business led overall results with underlying EBIT $116 million
- Strong market focus and major cost reductions resulted in improved domestic sales volumes and margins
- Improved domestic market conditions in Indonesia increased demand for residential steel roofing and steel building frames
- Construction of second metallic coating line in Indonesia on track to be operational in third quarter FY2011
- Political environment in Thailand stablised but markets remain cautious
- Sales volumes rise for China Butler Buildings by 27% and by 29% for Lysaght from improved industrial and public sector demand
| FY 2010 | FY 2009 | |
|---|---|---|
| External Despatches ('000s of tonnes) |
||
| Domestic | 889 |
717 |
| Export | 89 | 109 |
| Revenue ($M) | 1,349 | 1,543 |
| EBIT ($M) | 116 | (94) |
| Underlying EBIT ($M) | 116 | (21) |
| Net Operating Assets (pre-tax) ($M) | 899 | 833 |
| Return on Net Assets (pre-tax) | 14% | (8%) |
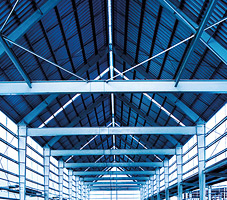
HOT ROLLED PRODUCTS
NORTH AMERICA
Impressive result from North Star BlueScope Steel, our US steel-making joint venture
- $119 million increase in underlying EBIT mainly due to a 33% increase in despatch volumes
- High capacity utilisation rates maintained due to reputation for on-time delivery, quality and customer responsiveness
- Recovery in auto sales and production, service centre restocking and an improved agricultural sector lifts sales volumes
- Receives highest customer satisfaction rating in Jacobson & Associates survey for eighth consecutive year
| FY 2010 | FY 2009 | |
|---|---|---|
| External Despatches ('000s of tonnes) |
||
| Domestic | 924 | 693 |
| Export | – | – |
| Revenue ($M) | – | – |
| EBIT ($M) | 61 | (58) |
| Underlying EBIT ($M) | 61 | (58) |
| Net Operating Assets (pre-tax) ($M) | 172 | 183 |
| Return on Net Assets (pre-tax) | 34% | (22%) |
COATED AND BUILDING PRODUCTS NORTH AMERICA

Challenging year in a tough market
- Steelscape increased market share with despatches up 37% due to improved demand
- Demand for new non-residential buildings weak with external despatches down 35% for BlueScope Buildings
- Integration program in Buildings business over last 2 years improves its ability to handle current market weakness and materially benefit from future market improvement
- External shipments lower for ASC Profiles and Metl-Span from continued weak economic conditions
| FY 2010 | FY 2009 | |
|---|---|---|
| External Despatches ('000s of tonnes) |
||
| Domestic | 521 | 553 |
| Export | 14 | 19 |
| Revenue ($M) | 1,307 | 2,189 |
| EBIT ($M) | (21) | (93) |
| Underlying EBIT ($M) | (16) | 9 |
| Net Operating Assets (pre-tax) ($M) | 806 | 919 |
| Return on Net Assets (pre-tax) | (3%) | (8%) |